🚀 Diploma in AI Integrated Development: Web × Apps × Data Science 將於 2026年5月7日 開始 Early Bird 優惠 🎓 英國學歷課程! NCC Diploma in Computing 將於 2026年5月5日 註冊截止日期 Limited Seats
🔥 NEW 全新選項

報讀 Diploma in Business Data Analysis 課程
只需額外 +$1,000 即可參加 AI 實戰面授課程!

查看詳情
AI Agent Development Course Promotion Banner

Diploma in Business Data Analysis, Machine Learning, and Workflow Automation
商業數據分析、機器學習與工作流程自動化文憑📱💻🤖

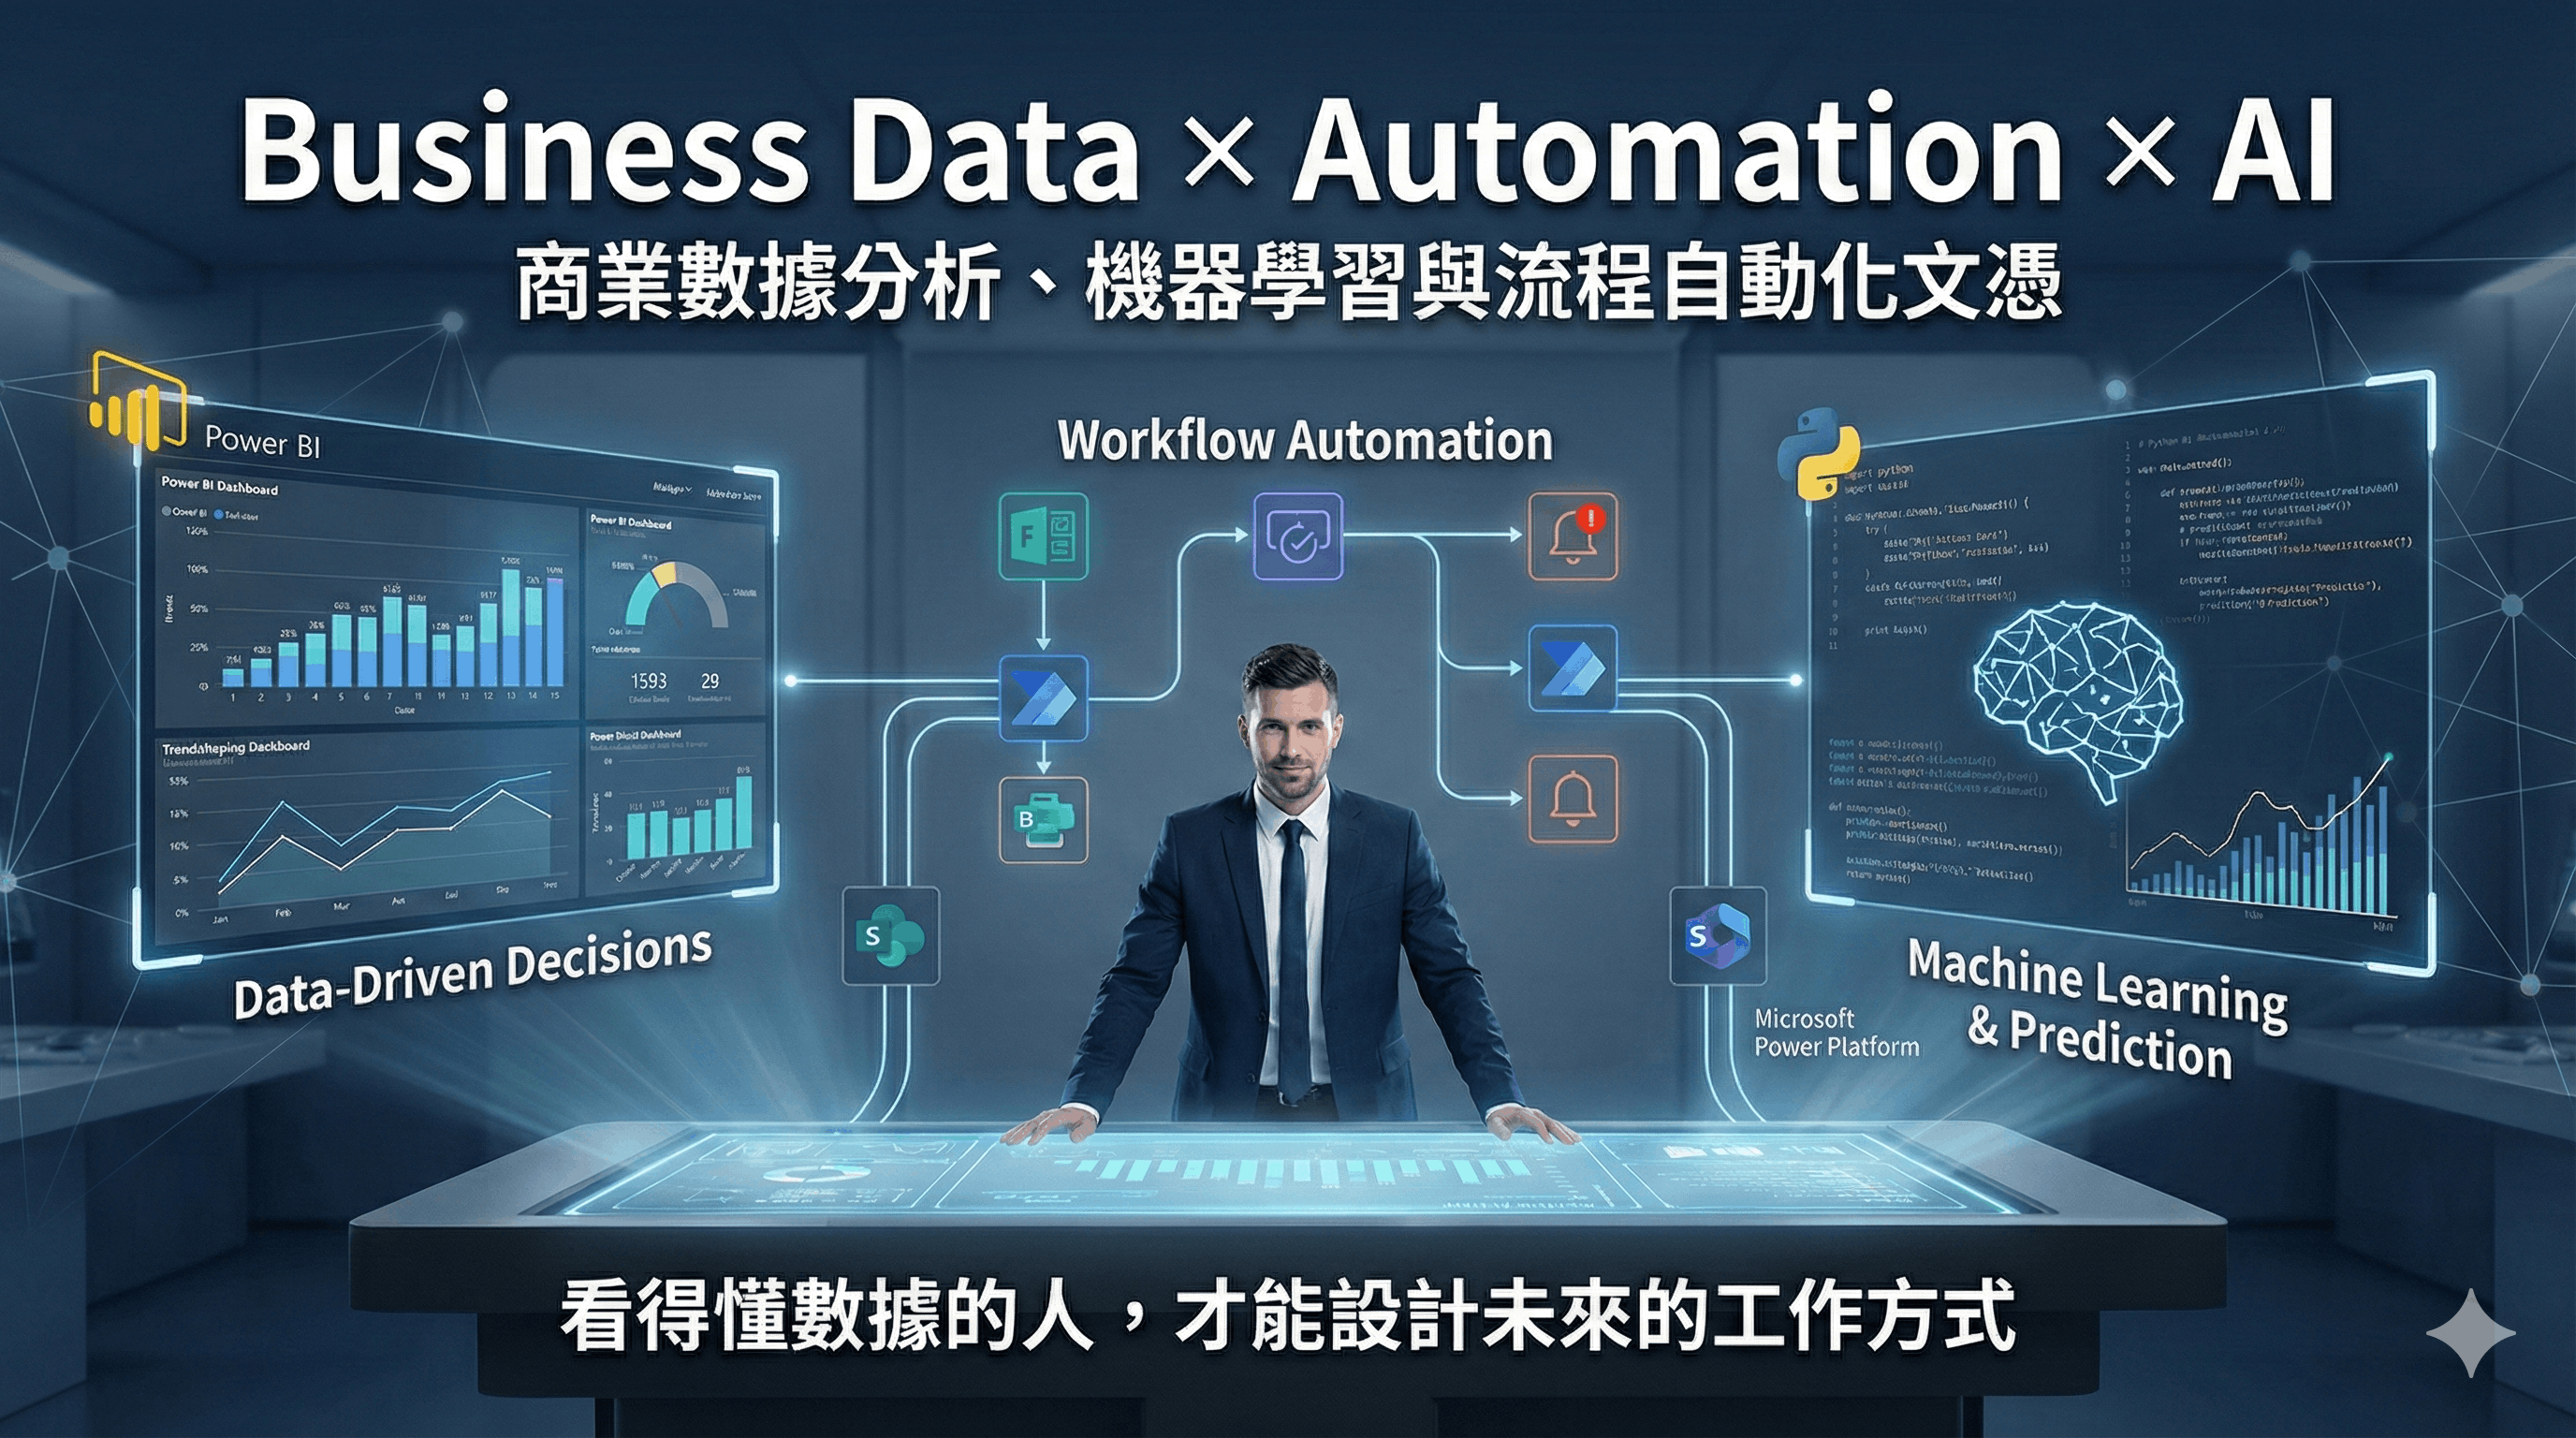
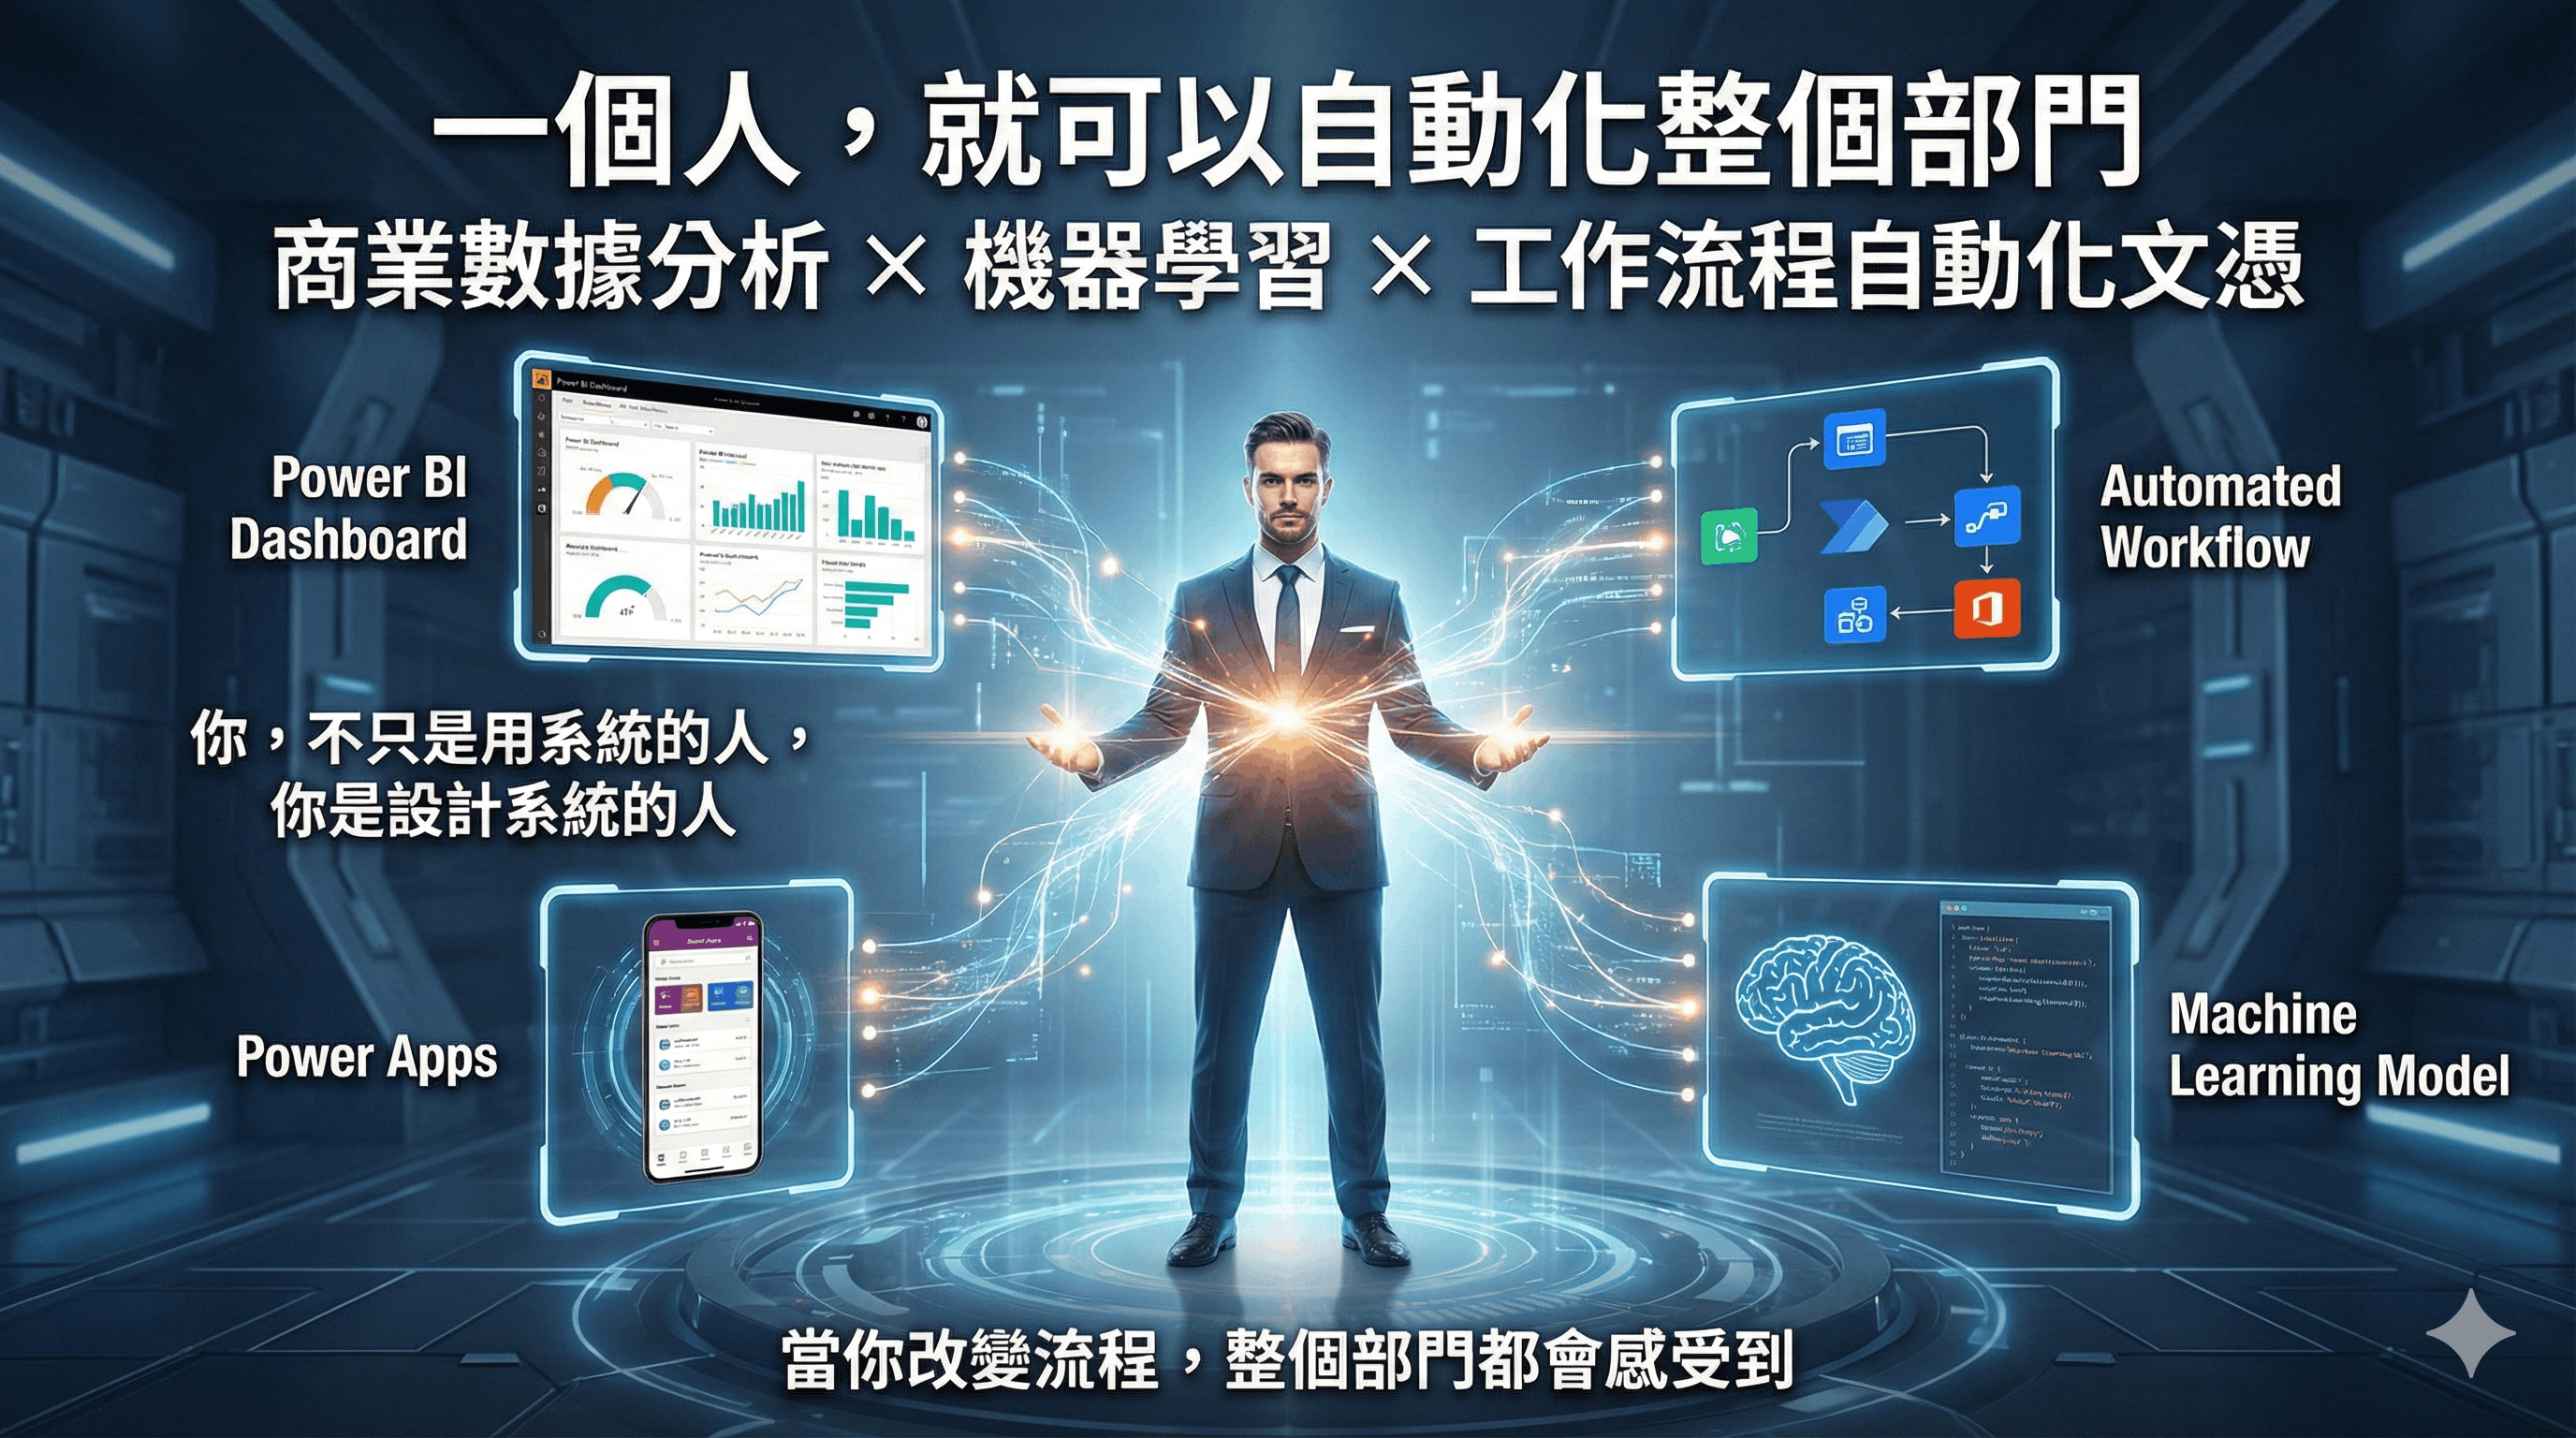
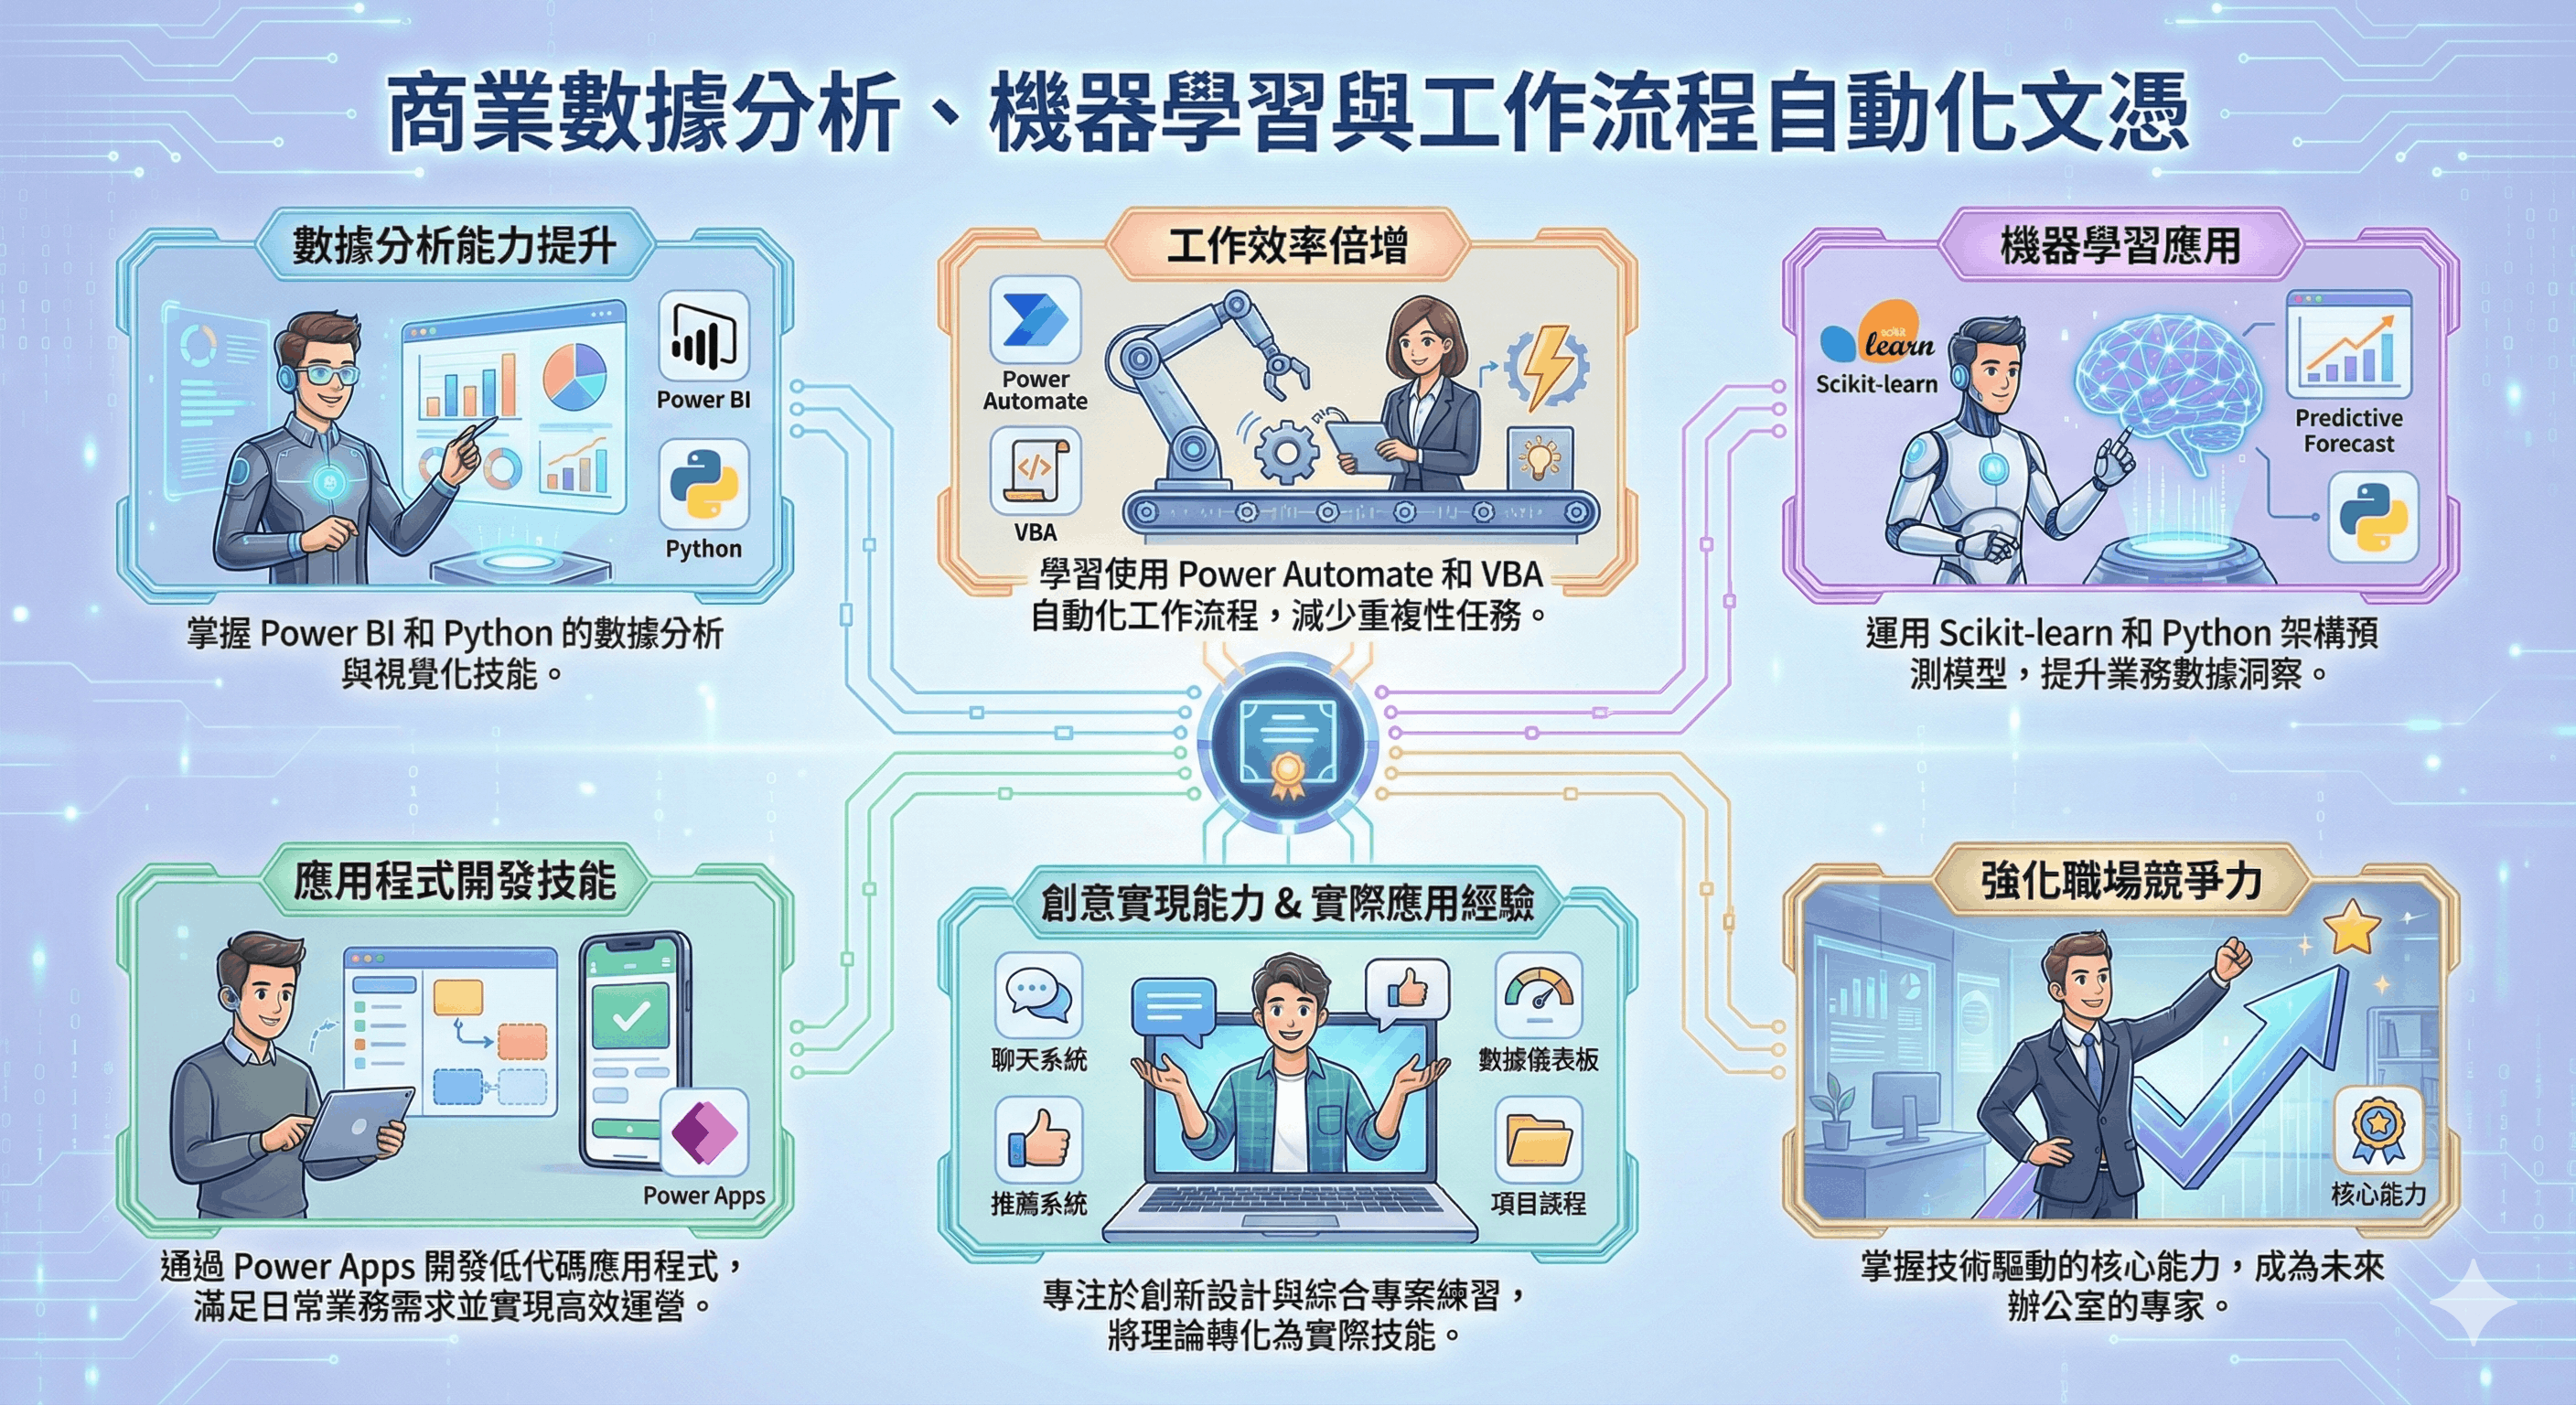
本課程專為希望掌握數據分析、流程自動化和數據預測技能的人士設計,幫助學員在 AI 驅動的未來辦公室中脫穎而出。 課程內容涵蓋 Power BI、Power Automate 和 Power Apps,這些是 Microsoft Power Platform 的核心工具。 此外,課程還包括 Microsoft 365 工具,如 SharePoint、MS Form、Excel 365 和 VBA 技能,幫助學員高效管理數據和協作工作。 學員還將學習如何運用 Python 進行數據分析、工作流程自動化,以及機器學習,全面提升技術應用能力與工作效率。

Power Platform Banner

課程特色 ✨

  • 全方位技能培養: 學習數據分析、流程自動化、機器學習和低代碼應用開發,結合視頻課程實現高效學習與應用。
  • 開發實用應用 🤖: 使用 Power Apps 或 Python 開發實用的業務應用程式,滿足企業日常需求。
  • 實作專案導向 🛠️: 以實際專案為核心,涵蓋數據分析、應用程式開發和機器學習,幫助學員掌握實用技能。
  • 降低學習門檻 🪜: 即使是零基礎學員,也能透過結構化課程輕鬆上手,快速掌握核心技能並實現創意。
  • 靈活學習結構 📚: 可反復播放視頻課程,按需學習單元,或參加整套課程培訓。

課程收穫 🎓

  • 💡 數據分析能力提升: 掌握 Power BI 和 Python 的數據分析與視覺化技能。
  • ⚙️ 工作效率倍增: 學習使用 Power Automate 和 VBA 自動化工作流程,減少重複性任務。
  • 🤖 機器學習應用: 運用 Scikit-learn 和 Python 架構預測模型,提升業務數據洞察。
  • 📱 應用程式開發技能: 通過 Power Apps 開發低代碼應用程式,滿足日常業務需求並實現高效運營。
  • 🎨 創意實現能力: 專注於創新設計,開發如聊天系統、推薦系統、數據儀表板等實用項目。

完成課程後,您將具備:

  • 全方位技能: 數據分析、流程自動化和應用程式開發。
  • 實際應用經驗: 綜合專案練習,幫助您將理論轉化為實際技能。
  • 強化職場競爭力: 掌握技術驅動的核心能力,成為未來辦公室的專家。

課程目標對象 👩‍💻👨‍💻

  • 🔰 職場新手與專業人士: 對數據分析、應用程式開發或自動化技術感興趣的入門者或有經驗的專業人士。
  • 💡 創業者與設計師: 希望高效實現創意、降低開發成本的創新型人才。
  • 🏆 管理者或主管: 希望了解並應用數據分析、自動化和相關工具優化業務流程的管理者或主管。

為什麼選擇這課程? 🤔

  • 🚀 快速上手: 通過結構化的視頻課程,學員可以反復播放學習內容,輕鬆掌握數據分析、流程自動化和應用開發技能。
  • ⚙️ 提升效率: 結合視頻演示與實際案例,幫助學員快速理解並應用技術於工作流程中,專注於創新和高效執行。
  • 👩‍🏫 專業講師指導: 課程由經驗豐富的專業講師授課,他們曾培訓過眾多知名企業,確保學員在實戰中掌握技能。
  • 🎥 靈活視頻學習: 提供課程視頻錄製,學員可隨時隨地學習,無限次回放,確保完全掌握技能。

你將學到什麼 💡

使用 Power Automate 自動生成訂單收據 (Order Form)。

使用 Power Automate 生成休假申請批准。

使用 Python 合併 Excel 工作表。

使用 機器學習預測數據與分類。

使用 Power BI 和 Python 清理與分析數據。

使用 Excel VBA 合併 Excel 工作表。

使用 Power Automate 接收與儲存投標書。

使用 Power Apps 創建訪客簽入系統。

使用 Power Apps 創建 Meeting Room 預訂系統。

課程工具 🛠️

這些工具在數據分析、自動化和應用程式開發中扮演著重要角色,並且許多工具提供免費版本或試用版,讓使用者可以先行體驗其功能。

Power BI

用於創建互動式儀表板和數據視覺化的商業智能工具。

了解更多

Python

用於數據分析、自動化和構建機器學習模型的程式語言。

了解更多

Power Automate

一個低代碼平台,用於自動化工作流程和跨應用程式的重複性任務。

了解更多

Power Apps

用於開發低代碼應用程式以解決業務問題和簡化流程的平台。

了解更多

VBA

一種腳本語言,用於在 Microsoft Office 應用(如 Excel)中自動執行任務。

了解更多

Office 365

一組包含 Excel、Outlook、SharePoint 和 Teams 的生產力工具,用於協作和自動化工作。

了解更多

Scikit-learn

一個 Python 函式庫,用於構建和評估機器學習模型。

了解更多

Pandas

一個強大的 Python 資料分析函式庫,用於操作和分析結構化資料。

了解更多

Matplotlib

一個 Python 函式庫,用於創建靜態、互動式和動畫式視覺化圖表。

了解更多

OpenPyXL

一個 Python 函式庫,用於讀取和寫入 Excel 檔案 (xlsx/xlsm 格式)。

了解更多

Scikit-learn

一個 Python 函式庫,用於構建和評估機器學習模型。

了解更多

Langchain

一個框架,用於構建應用程序,支持大型語言模型的集成和工作流自動化。

了解更多

導師簡介

Dannis Mok

He has rich experience in business web and apps system development and over 25 years of teaching experience. He has a great passion for learning and teaching new technologies, and his teaching style is clear, to the point, and simplifies complex technologies into easy-to-understand terms.

He has delivered various workshops and classes for well-known corporates, government departments, and local universities, specializing in office automation, data science, data analysis, and business web and apps system development. He is the principal lecturer for NCC Education and University of Greenwich, and has provided training that equips professionals with practical skills tailored to industry needs.

By leveraging his expertise in these areas, he has successfully trained professionals in corporate organizations and government departments to enhance efficiency, adopt data-driven decision-making, and embrace automation technologies.

In addition to his BSc degree in IT, he holds an MBA, an MSc in IT, and an MSc in Telecommunication.

Microsoft MOS Master Microsoft MOS Word Microsoft MOS Excel Microsoft MOS PowerPoint Microsoft MOS Access CompTIA Data Plus Microsoft Power BI Data Analyst Associate Python Institute PCAP
相關專業認證
  • Microsoft MCSE, MCDBA
  • Microsoft Certified System Developer
  • Microsoft Office Specialist Master
  • Cisco CCNA,CCDA,CCNP,CCDP
  • Sun Microsystems – Certified Java Programmer
  • Oracle – Certified Database Professional
  • Linux - LPI Level 1 & 2
  • CompTIA Data+
  • Microsoft Certified: Power BI Data Analyst Associate
  • Python Institute: Certified Associate Python Programmer
相關教學經驗
  • 為積金局 (MPF) IT 員工提供 Android 及 iPhone 視像培訓課程
  • 為香港教育局提供 Android 培訓課程予中學電腦科導師
  • 為香港教育大學 IT 員工提供 Cordova 跨平台流動程式開發課程
  • 為房屋署員工 IT 員工提供 HTML5 跨平台流動程式開發課程
  • 為房屋署員工 IT 員工提供 Android 及 iPhone 平台流動程式開發課程
  • 為香格里拉大酒店IT 員工提供 Android 流動程式開發課程
  • 為勞工處提供 HTML5 遊戲培訓課程及電子商店培訓課程
  • 為中國銀行IT 員工提供 Android 及 iPhone 流動程式開發課程
  • 為香港郵政IT 員工提供 Angular 8 程式開發課程
  • 為 VTC 職業訓練局提供各種各類 IT 培訓課程
  • 為醫管局員工 IT 員工提供跨平台流動程式開發課程

視像課程內容

觀看期為期一年 ,可在家無限重播。

AI Office Diploma Course Content
PowerBI Relationship (08m:59s)
Python Pandas (06:32)
PowerAutomate Auto Sum Up (06:32)

網上學習系統

為配合在職人士的需求,本校的課程已全部錄影,學員可因應自己的學習進度,隨時隨地選擇任何一科開始學習。學員有充裕的時間去不斷重溫及重播相關技術課程片段,務求令自己掌握相關技術。

詳細視像課程內容,請登入網上學習系統觀看。

登入戶口: demo

登入密碼: demo

LOGIN
Studying in UK NCC Education Level 5 in Computing

課程內容

本課程由多個部分所組成,學員可因應自己需求導讀個別單元或整個課程。

Data Analysis

PowerBI

3 堂 (7.5 小時)面授課程錄影

Power BI 是 Microsoft 提供的一款專為資料分析與互動圖表設計的免費工具。隨著大數據時代的來臨,各企業擁有大量資料可供分析,藉此挖掘商業智慧。我們將逐步學習如何利用 Power BI 和 Excel Power Pivot,將不同來源的資料進行整理與格式化(使用 Power Query Editor),並建立資料關係(Relationships)形成資料模型(Data Model)。接著,依賴這些模型製作互動式儀表板(Dashboard),同時學習使用 DAX 函數進行深入分析,超越 Excel 傳統的數據分析能力,全面提升資料處理效率與洞察能力。

Power BI Banner

Power Apps Logo

Certificate in PowerBI Data Analysis (CBD2025)

適合初學者修讀,無需任何經驗,
由淺入深教學

What you can learn ?

  • Learn how to transform data in suitable format
  • Learn how to build the relationships between tables
  • Learn how to build the data model (star or snowflake)
  • Learn how to create various visualizations
  • Learn how to create report and dashboard
  • Learn how to upload the report to PowerBI Services
  • Learn how to use the PowerBI mobile apps
  • Learn how to write the DAX functions
  • Learn how to use the calculated columns
  • Learn how to create the measures
  • Learn how to create the KPI metrics
Power BI

COURSE OUTLINE

  • Installing and running PowerBI Desktop
  • Applying PowerBI Service free account
  • Installing PowerBI Mobile Apps
  • Understanding the PowerBI Desktop and Query Editor

  • Importing Excel data into PowerBI Desktop
  • Importing Access database into PowerBI Desktop
  • Importing CSV text files into PowerBI Desktops
  • Importing data from other data sources

  • Define data types for different columns
  • Transform existing columns (text,number,date)
  • Adding and removing columns or rows
  • Unpivot data by transposing columns and rows
  • Modifying query and undoing steps)

  • Appending multiple queries
  • Merging queries by different join types
  • Query from a folder
  • Understanding M language
  • Conditional columns and Add Column from Example

  • Understanding Star schema and Snowflake schema
  • Building the 1 to many and 1 to 1 relationships between tables
  • Understanding filter context and its flow direction
  • Understanding active and inactive relationships
  • Adding a Date table for time intelligence functions

  • Buidling various reports by using the visuals
  • Choosing various visuals for presenting data
  • Introducing Matrix,Columm,Stack,Bar,Pie,Waterfall,KPI,Gauge,Maps
  • Grouping and binning data
  • Applying various filters (Visual,Page,Report,Drillthrough)

  • Uploading data and reports from PowerBI Desktop
  • Building a PowerBI dashboard
  • Preparing data sets for Q&A natural language queries
  • Sharing dashboard to other PowerBI accounts
  • Accessing the reports through PowerBI Mobile

  • Creating calculated columns and measures using DAX functions
  • Understanding implicit and explicit measures
  • Using CALCULATE functions to alter the filter context
  • Using FILTER functions to filter data
  • Introduction to Time Intelligence functions
  • Understanding implicit and explicit measures
  • Using RELATED and RELATEDTABLES functions to relate data
  • Understanding SUMX,COUNTX,AVERAGEX,MAXX,MINX functions to summarize data
  • Creating calculated table by using SUMMARIZE functions

  • Create the calculated columns using DAX functions
  • Create the measures using DAX functions
  • Understanding the functions of Date table
  • Create the KPI metrics for each measure
  • Combining measures to create new measures
  • Export data from the data model


Workflow Automation

Power Automate
(Desktop + Cloud)

3 堂 (7.5 小時)面授課程錄影

Power Automate Desktop 是免費的 RPA 工具,能自動執行重複性桌面任務,如數據輸入與檔案處理。用戶可錄製操作步驟,快速實現工作流程自動化。 Power Automate Cloud Flow 是基於雲端的自動化工具,可串連多種服務(如 Outlook、Teams、SharePoint),自動處理郵件、同步日曆與通知更新。它支援條件邏輯,靈活設計跨系統流程。 結合 Desktop 和 Cloud Flow,用戶能打通桌面與雲端工作流程,顯著提升效率,減少出錯機會,強化業務自動化能力。

Power Automate

Power Automate Logo

Certificate in Workflow Automation using Power Automate (CWP2025)

適合初學者修讀,無需任何經驗,
由淺入深教學

What you can learn ?

  • Learn how to create cloud flow
  • Learn how to create desktop flow
  • Learn how to schedule the flow to run
  • Learn how to make decision in flow
  • Learn how to use loop in flow
  • Learn how to automate Excel operations
  • Learn how to send customized buld emails
  • Learn how to setup the approval flow
  • Learn how to use the SharePoint lists in flow
  • Learn how to use the SharePoint libraries in flow
  • Learn how to use the SharePoint forms in flow
Workflow

COURSE OUTLINE

  • Understanding different types of flow
  • Components of a flow - connector, actions, and triggers
  • Using the Power Automate Web Portal
  • Using the Power Automate Mobile Apps
  • Build the flow from templates

  • Build a flow using email connectors
  • Reading and Filtering Email
  • Saving attachments to OneDrive or SharePoint
  • Using the Apply to each function to handle multiple attachments

  • Build a flow using file connectors
  • Making an archive for email attachments in SharePoint
  • Publishing files to Dropbox
  • Using Expression to format the folder name

  • Building a button flow using the template
  • Creating a button flow to email a manager
  • Executing a button flow using the mobile

  • Learning about push notifications
  • Configuring a notification for emails from the manager
  • Using the Notification connector and condition control

  • Sharing a cloud flow with others
  • Sharing a flow with run-only permission
  • Managing the shared flows

  • Understanding condition operators
  • Using expressions and multiple conditions (AND or OR)

  • Understanding Dataverse
  • Create an approval flow
  • Responding to approvals

  • Working with sequential approvals
  • Working with parallel approvals
  • Adding parallel branches

  • Understanding the Forms connector
  • Creating a basic form
  • Processing a form

  • Installing Power Automate Desktop
  • Create a basic desktop flow
  • Understanding variables and the expression
  • Using lists and data tables to store data
  • Create decision making and loops

  • Build the flow with Excel
  • Reading data from Excel
  • Writing data to Excel
  • Looping and handle the data in the Excel range
  • Accessing the file and the folders
  • Create a flow to check stocks and fill in orders

  • Understanding the UI elements
  • Create the flow by recording
  • Create the flow by capturing the UI elements
  • Create the flow to capture data from the web


Power Apps

Power Apps

3 堂 (7.5 小時)面授課程錄影

Microsoft Power Apps 是一個低代碼平台,專門用來快速開發自定義應用程式,無需複雜的程式設計技術。 它的核心功能是基建於 Microsoft Dataverse,並能無縫整合其他 Microsoft 服務,例如 SharePoint、OneDrive、Teams 和 Dynamics 365。 透過 Power Apps,企業可以輕鬆建立跨平台的應用程式,支持 Web 和 Mobile,從而解決業務流程中的特定需求。 配合 Power Automate,能將應用與自動化工作流程結合,進一步減少手動操作,提升效率。如再結合 Power BI,還可以將應用程式中的數據進行即時的可視化分析,幫助企業做出數據驅動的決策。 Power Apps 不僅能讓 IT 專業人士構建複雜應用,還能讓業務用戶(Citizen Developers)快速上手,成為企業數位化轉型的強大助力。

Big Data and Data Analysis

Power Apps Logo

Certificate in Power Apps Development (CPA2025)

適合初學者修讀,無需任何經驗,
由淺入深教學

What you can learn ?

  • Learn how to create Canvas Apps
  • Learn how to design user-friendly interfaces
  • Learn how to connect apps to various data sources(e.g., SharePoint, Excel)
  • Learn how to use Power FX for implementing logic in your apps
  • Learn how to create dynamic forms with validation
  • Learn how to integrate Power Automate with Power Apps for workflow automation
  • Learn how to set up security roles and permissions for apps
  • Learn how to publish and share apps with users
  • Learn how to manage collections and variables for advanced app functionality
  • Learn how to use SharePoint Lists and Dataverse as data sources in apps
  • Learn how to create apps for collecting feedback and other practical use cases
Low Code

COURSE OUTLINE

  • Overview of Power Apps and its capabilities
  • Understanding the Power Apps ecosystem (Canvas Apps)
  • Use cases and benefits of using Power Apps

  • Navigating the Power Apps interface
  • Creating a Power Apps account
  • Overview of the Canvas App type and its purpose

  • Understanding Canvas Apps and their flexibility
  • Step-by-step guide to creating a simple Canvas App
  • Practical Example: Create a basic app to collect feedback from users

  • Connecting to various data sources (e.g., SharePoint, Excel, SQL Server)
  • Understanding Common Data Service (Dataverse)
  • Practical Example: Connect your Canvas App to a SharePoint List

  • Using controls and components to design the app
  • Best practices for user experience and accessibility
  • Practical Example: Design a user-friendly form with validation

  • Introduction to Power FX and its syntax
  • Common functions and expressions in Power FX (e.g., If, Switch, LookUp, Filter)
  • Practical Example: Use Power FX to implement conditional logic and data filtering in your app

  • Working with collections and context variables
  • Using functions for data manipulation (e.g., ForAll, ClearCollect)
  • Practical Example: Create a dynamic data table using collections and implement search functionality

  • Integrating Power Automate flows into Power Apps
  • Automating tasks and processes triggered by app actions
  • Practical Example: Create a flow that sends email notifications when a form is submitted in Power Apps

  • Understanding security roles and sharing apps
  • Best practices for securing your apps and data
  • Practical Example: Set up user permissions for different roles in an app

  • Steps to publish your app for users
  • Sharing options and collaboration features
  • Practical Example: Share your app with colleagues and gather feedback
Office

Office 365 + VBA

3 堂 (7.5 小時) 面授課程錄影

Microsoft Office 365 Excel 是一個強大的數據處理工具,隨著雲端技術的進步,Excel 在 Office 365 中新增了多項功能,讓數據處理更加高效和智能。 新功能包括 動態陣列公式(如 FILTER、UNIQUE、SORT 等),能直接產生動態結果,提升數據篩選和分析效率。XLOOKUP 是另一個強大的更新,取代傳統的 VLOOKUP,提供更靈活的數據查找方式。此外,Excel 還支援與 Power Query 整合,便於清洗和轉換大型數據集。 VBA(Visual Basic for Applications) 則是 Excel 的自動化利器,用戶可以編寫宏來完成重複性工作,例如數據導入、報表生成和流程自動化。 透過 Office 365 Excel 的新功能與 VBA,自動化數據處理及分析變得更加簡單,大幅提升業務生產力及準確性。

Excel 365 + VBA

Excel 365 Logo

Certificate in Office 365 and VBA (COA2025)

適合初學者修讀,無需任何經驗,
由淺入深教學

What you can learn ?

  • Learn how to use Xlookup function to find data
  • Learn how to use Dynamic Array functions
  • Learn how to use Power Query to clean data
  • Learn how to use Power Query to automate workflow
  • Learn how to use Power Pivot to create data model
  • Learn how to use Power Pivot to create DAX formula
  • Learn how to use Power Pivot to create KPI
  • Learn how to use Pivot Table to create dashboard
  • Learn how to use recrod macro to automate task
  • Learn how to write VBA codes to automate task
  • Learn how to create User Form to interact with users
Workflow

COURSE OUTLINE

  • Introduction to Array formula and Dynamic Array functions
  • Introduction to Xlookup function
  • How to handle unmatched situations
  • Lookup information using Exact Match and Approximate Match
  • Lookup from top to bottom or from bottom to top
  • Lookup from left to right or from right to left
  • Lookup data with wildcard characters
  • Use of SortBy, Sort, Unique, Filter, Transpose, Sequence and Let functions
  • Understanding Spill Out, Implicit Interaction and @ operator

  • Power Query Application (Transform Data and Automate Workflow)
  • Difference between the Power Query in Excel and Power BI
  • Use Power Query to import data from different data sources(Text File, Excel, Database or Web)
  • Understanding the Applied Steps generated
  • Select the destinations where the transformed data go
  • Manage the Data Types of the columns
  • Use the Locale to handle the Date and Number Formats
  • Performs some basic transformations – Remove Rows and Columns
  • Performs some basic transformations – Find and Replace Values
  • Performs some basic transformations – Filter Rows
  • Performs some basic transformations – Split Up Column
  • Performs some basic transformations – Date, Text and Number Transformation
  • Performs some basic transformations – Create New Columns
  • Performs some basic transformations – Using Conditionals
  • Performs some basic transformations – Fill in Empty Values
  • Performs some basic transformations – Pivot and Unpivot Columns
  • Understanding the underlying M code
  • Combining data by appending multiple queries
  • Combining data by merging multiple queries
  • Sharing the Query between Power BI and Excel
  • Error Handling and how to handle the errors
  • Clean the Non-delimited Text File from scratch
  • Change Data Source and use Refresh to handle new data source
  • Load data from a folder in order to handle new data source automatically
  • Reference Query and break up the query for easier management
  • View the Query Dependency diagram

  • Understand the concept of Data Model
  • Use PowerPivot for combining data tables to form Data Model
  • Install the COM add-in to enable PowerPivot menu
  • Load the data using Power Query into the PowerPivot
  • Build the relationships using Diagram View
  • Create the different types of PivotTables and PivotCharts using data model
  • Introduce the concepts of Calculated Columns and Measures
  • Discuss the DAX functions and the concepts of filter context
  • Create the KPI icons for the Measures
  • Adding the Date table for enabling the Time Intelligence functions
  • Build the Pivot Charts to visualize the data
  • Apply the Slicers and Timeline to filter data
  • Use the calculated fields to generate new fields in the data set
  • Group and ungroup the data to have different summarization angles
  • Format the Pivot table as a report
  • Build the simple dashboard using PivotTable and PivotCharts

  • Understanding Macros and how to record the actions
  • Use of VBA Editor to read and edit the Macros
  • Make use of Relative and Absolute Addressing in Macros
  • Copy and Share the Marcros to others
  • Understanding Macros security setting
  • Run the marcos through various methods

  • VBA programming concepts
  • Use of basic variables to store number, text, date and boolean values
  • Use of array variables to store a group of values
  • How to make decision using "IF THEN ELSE" structure
  • How to repeat operations using "FOR LOOP" structure
  • Make use of other loops like "DO WHILE LOOP" and "DO UNTIL LOOP"
  • Understanding Excel Object Model
  • Understanding how to use object methods
  • Understanding how to access object properties
  • Use of Application, WorkBooks, WorkSheets, Range and Cell objects
  • Use of InputBox and MsgBox to get and show information
  • Call Worksheets functions in VBA
  • Understanding Sub Procedures to structure the program
  • Write Function Procedures to create custom functions
  • Write Event Procedures to trigger actions when certain events happen/span>
  • Learn how to use immediate window and watch window to debug codes
  • Learn how to run through the code step by step

  • Build UserForm to allow user to input data through a form
  • Use the TextBox to collect text
  • Use the Option Button or Checkbox to select data
  • Use the ListBox and ComboBox to select data
  • Use the Button to run codes


Data Analysis & Workflow Automation

Python

3 堂 (7.5 小時) 面授課程錄影

Python 是一種易學易用的通用程式語言,並將整合到新一代 Excel 中。透過 Python 及其相關程式庫,用戶可實現數據分析、數據視覺化(使用 Matplotlib),以及辦公流程自動化(使用 openpyxl 自動處理 Excel)。此外,Python 還能與 Power BI 結合,強化數據分析和視覺化能力。我們將逐步教授 Python 的基礎知識,幫助學習基本編程,並運用 Python 提升 Power BI 和 Excel 的效率與功能。

Big Data and Data Analysis

Power Apps Logo

Certificate in Python Data Analysis (CPD2025)

適合初學者修讀,無需任何經驗,
由淺入深教學

What you can learn ?

  • Learn how to use variables to store simple data
  • Learn how to use List and Dictionary data structures
  • Learn how to use decision making
  • Learn how to use looping
  • Learn how to use Pandas to store data
  • Learn how to import and export Pandas data
  • Learn how to use draw charts using Matplotlib
  • Learn how to control Excel using OpenPyXL
  • Learn how to automate Excel operations
  • Learn how to use Python with PowerBI
  • Learn how to enhance PowerBI with Python
Python

COURSE OUTLINE

  • Environment Setup (Jupyter and VS Code)
  • Basic Syntax
  • Variable Types
  • Basic Operators
  • Decision Making
  • Loops (For, While)
  • Numbers and Strings
  • Lists and Tuples
  • Dictionary and Set
  • Functions and Lambda
  • List Comprehension
  • Modules (DateTime, Math, JSON, CSV)

  • Pandas Series and DataFrames
  • Pandas Read CSV and JSON
  • Change Column, Rows and Data Types
  • Select Rows by Index Position or Labels
  • Select Columns by Name or Index
  • Add Column or Rows to DataFrame
  • Drop Column or Rows From DataFrame
  • Iterate Over Rows
  • Apply functions
  • Join, Merge and Concat DataFrames

  • Read Excel file as Pandas DataFrame
  • Data checking for null, unique value and formatting
  • Data cleaning for null, spaces, cases and duplicates
  • Data preprocessing by merging, sorting, grouping and breakdown
  • Data extraction by location, by label, by condition
  • Data filtering by conditions (AND,OR,NOT)
  • Data summary by subtotal and pivot
  • Data output to Excel or to CSV

  • Matplotlib Introduction
  • Matplotlib Plotting
  • Axis, Title and Label
  • Plot Parameters (Color, Size and Style)
  • Figure and Axes
  • Multiplots
  • Using Subplots

  • OpenPyXL Introduction
  • Read Excel File
  • Iterating Rows and Columns
  • Iterating from a range
  • Create and Add Content to a Workbook
  • Write a List to Worksheet
  • Rename, Add and Remove Worksheet
  • Insert and Delete Rows and Columns
  • Set the Font, Alignment and Color for the Cells
  • Use OpenPyXL to consolidate Excel invoices distributed in different files and sheets

  • Configure PowerBI with Python
  • Get Data using Python Scripts
  • Update the Python Script
  • Create the Visual using Python
  • Transform Data using Python
  • Introduction of Regular Expression
  • Regular Expression - Match, Search and Sub function
  • Example 1 - Remove Bad Email Address Rows
  • Example 2 - Mask out all phone numbers and ID card numbers
  • Example 3 - Call external API to process data (Using Google Geocoding API)


Machine Learning

Machine Learning, LLMs, and RAG Applications

4 堂 (10 小時) 面授課程錄影

機器學習(Machine Learning)是一種利用數據驅動的技術,能自動從數據中學習模式並進行預測與決策。Python 是機器學習的首選語言,核心工具包括 NumPy、Seaborn 和 Scikit-Learn。NumPy 是 Python 的數值計算基礎,用於處理大量數據和矩陣運算,為機器學習模型提供高效的數據處理能力。Seaborn 用於數據視覺化,幫助商業用戶快速探索數據模式,如直方圖和熱力圖。Scikit-Learn 提供強大的機器學習算法,用於分類、回歸、聚類和預測,幫助企業分析銷售趨勢和客戶行為。

此外,本課程還將介紹使用 Ollama 和 Langchain 構建私有 LLM(大型語言模型)的方法,以處理企業內部文件。學員將學習如何建立 RAG(檢索增強生成)應用,這將進一步提升在私有數據環境中的信息檢索和生成能力。 結合 NumPy、Seaborn、Scikit-Learn、Ollama 和 Langchain,機器學習能讓企業高效處理數據、分析業務模式並實現數據驅動的決策,大大提升競爭力。

Machine learning with Python

Scikit learning Logo

Certificate in Python Machine Learning (CPM2025)

學生在學習之前應具備基本的 Python 和 Pandas 知識,
以便更有效地掌握後續的數據分析和機器學習技術

What you can learn ?

  • Learn how to use REST APIs to interact with web services via requests.
  • Learn how to create advanced charts and visualizations using Seaborn.
  • Learn how to manage and manipulate multi-dimensional arrays using NumPy.
  • Learn how to train machine learning models to make predictions.
  • Learn how to perform regression analysis using Scikit-Learn.
  • Learn how to implement classification techniques using Decision Trees.
  • Learn how to apply K-Means clustering for unsupervised learning tasks.
  • Learn how to evaluate model performance using a confusion matrix.
  • Learn how to deploy machine learning models to the web using Streamlit.
  • Learn the objectives of using Large Language Models (LLMs) to enhance natural language understanding and generation in business contexts.
  • Learn how to build Retrieval-Augmented Generation (RAG) applications to improve information retrieval and content generation.
  • Learn how to use Langchain to streamline workflows involving LLMs and data processing.
  • Learn how to use Ollama to develop and deploy private LLMs tailored to specific business documents and needs.
AI & ML

COURSE OUTLINE

  • Use Requests to send GET requests to download data.
  • Use Requests to send POST requests to update data.
  • Use Requests to call REST APIs.

  • Creating NumPy array objects.
  • Understanding data types, axes, and shapes.
  • Slicing subsets of data.
  • Data manipulation and broadcasting.
  • Basic statistical functions.
  • Reading from and writing to files.

  • Draw distribution plots.
  • Draw relational plots.
  • Draw regression plots.
  • Draw categorical plots.
  • Draw multi-plot grids.
  • Format and customize plots.

  • What is machine learning?
  • How and why machine learning helps.
  • Checking if a problem needs machine learning to solve.
  • Classification of machine learning algorithms.
  • Understanding supervised and unsupervised machine learning.
  • Validation metrics and methods.

  • Overview of Scikit-Learn's organizational structure.
  • Understanding estimators, transformers, and predictors.
  • Data preprocessing: handling missing data and scaling.
  • Encoding categorical data for models.
  • Preparing data for training and testing.

  • Classification and regression metrics.
  • Model selection techniques.
  • Train-test data split.
  • k-Fold cross-validation.

  • What is regression?
  • Linear regression with Scikit-Learn.
  • Polynomial regression with Scikit-Learn.
  • Build the pipeline and perform cross-validation.

  • What is classification?
  • Understanding decision trees.
  • Understanding random forests.
  • Decision tree and random forest with Scikit-Learn.

  • What is clustering?
  • Understanding K-Means clustering.
  • Determining the centroid and the number of clusters.
  • K-Means clustering with Scikit-Learn.

  • What is Streamlit?
  • Using the Streamlit command to create web pages.
  • Save and load models with Streamlit.
  • Deploy the model to the web for user interaction.

  • Understanding Large Language Models (LLMs) and their applications.
  • How to use LLMs for private and local document use cases.
  • Introduction to Ollama and LangChain library.
  • Downloading and running LLMs (Gemma, Meta Llama, DeepSeek) locally for free.
  • Customizing the local LLM for private data use.
  • Making free API calls to Ollama with local documents.
  • Building a simple RAG (Retrieval-Augmented Generation) system with Streamlit, Ollama, and LangChain.
  • Uploading private PDF and Word files to the system for driving business insights.


Certificate in Power BI Data Analysis

Course Code: CPD2025

Total Duration: 7.5 hours

  • Microsoft Power BI (7.5 hrs - 3 video lessons)

Price: $980

Certificate in Power Automate Workflow Automation

Course Code: CWP2025

Total Duration: 7.5 hours

  • Microsoft Power Automate (7.5 hrs - 3 video lessons)

Price: $980

Certificate in Power Apps Development

Course Code: CPA2025

Total Duration: 7.5 hours

  • Microsoft Power Apps (7.5 hrs - 3 video lessons)

Price: $980

Certificate in Python Data Analysis

Course Code: CDA2025

Total Duration: 7.5 hours

  • Python (7.5 hrs - 3 video lessons)

Price: $980

Certificate in Excel 365 and VBA

Course Code: EPQ2025

Total Duration: 7.5 hours

  • Excel 365 and VBA (7.5 hrs - 3 video lessons)

Price: $980

Certificate in Python Machine Learning

Course Code: CPM2025

Total Duration: 10 hours

  • Python Machine Learning (10 hrs - 4 video lessons)

Price: $1,280

Diploma in Microsoft Power Platform Application

Course Code: D3P2025

Total Duration: 22.5 hours (9 video lessons)

  • CPD2025 - Microsoft Power BI (7.5 hrs - 3 video lessons)
  • CWP2025 - Microsoft Power Automate (7.5 hrs - 3 video lessons)
  • CPA2025 - Microsoft Power Apps (7.5 hrs - 3 video lessons)

$2,980 $2,480

Diploma in Microsoft Power Platform and Python Application

Course Code: D4P2025

Total Duration: 30 hours (12 video lessons)

  • CPD2025 - Microsoft Power BI (7.5 hrs - 3 video lessons)
  • CWP2025 - Microsoft Power Automate (7.5 hrs - 3 video lessons)
  • CPA2025 - Microsoft Power Apps (7.5 hrs - 3 video lessons)
  • CDA2025 - Python (7.5 hrs - 3 video lessons)

$3,980 $3,480

Diploma in Microsoft Power Platform and Excel 365 Automation

Course Code: DPE2025

Total Duration: 30 hours (12 video lessons)

  • CPD2025 - Microsoft Power BI (7.5 hrs - 3 video lessons)
  • CWP2025 - Microsoft Power Automate (7.5 hrs - 3 video lessons)
  • CPA2025 - Microsoft Power Apps (7.5 hrs - 3 video lessons)
  • EPQ2025 - Excel 365 and VBA (7.5 hrs - 3 video lessons)

$3,980 $3,480

Diploma in Business Data Analysis, Machine Learning, and Workflow Automation

Course Code: DBW2026

Total Duration: 47.5 hours (19 video lessons)

  • CPD2025 - Microsoft Power BI (7.5 hrs - 3 video lessons)
  • CWP2025 - Microsoft Power Automate (7.5 hrs - 3 video lessons)
  • CPA2025 - Microsoft Power Apps (7.5 hrs - 3 video lessons)
  • CDA2025 - Python (7.5 hrs - 3 video lessons)
  • EPQ2025 - Excel 365 and VBA (7.5 hrs - 3 video lessons)
  • CPM2025 - Python Machine Learning (10 hrs - 4 video lessons)

🎉 Early Bird Discount! Enroll now and save big! 🎉

$6,180 $4,980

🎯 ADD-ON OPTIONS 額外選項

報讀此課程後,只需額外 +$1,000 即可參加以下任何一個 AI 實戰面授課程

📚 每個選項包含 4 堂面授課程

+$1,000
🤖

DB1

AI Python 數據分析與機器學習

Certificate in AI Data Science

  • ✅ AI 學習 Python 基礎
  • ✅ AI 輔助數據分析技術
  • ✅ 工作流程自動化
  • ✅ 機器學習入門與應用
+$1,000

DB2

AI Agent Development (n8n)

Certificate in AI Agent Development

  • ✅ n8n 工作流程自動化平台
  • ✅ 創建 AI 工作流程
  • ✅ AI Agent 開發技術
  • ✅ 商業應用案例實戰
+$1,000
💼

DB3

AI Office Tools & Copilot Agent

Certificate in AI Office Automation

  • ✅ Copilot 日常工作應用
  • ✅ Copilot Studio 建立 AI Agent
  • ✅ NotebookLM 智能筆記
  • ✅ Otter.ai 及其他 AI 工具

報名及付款方式

支付詳情

  • 轉數快: 快速支付系統識別碼: 108329293
  • 銀行轉帳: 恆生銀行 #789-681384-883
    (戶口名稱: UNiSOFT Education Limited)
  • 支票付款: 枱頭請寫 UNiSOFT Education Limited

注意: 如選用轉數快或銀行轉帳完成付款後,請將付款記錄 Whatsapp 到 90455522

校舍地址及聯繫方式

校舍地址: 九龍佐敦德興街12號興富中心5樓501室
辦公時間: 星期一至星期五 上午11時至晚上8時